Electroencephalography (EEG)
A Brief History
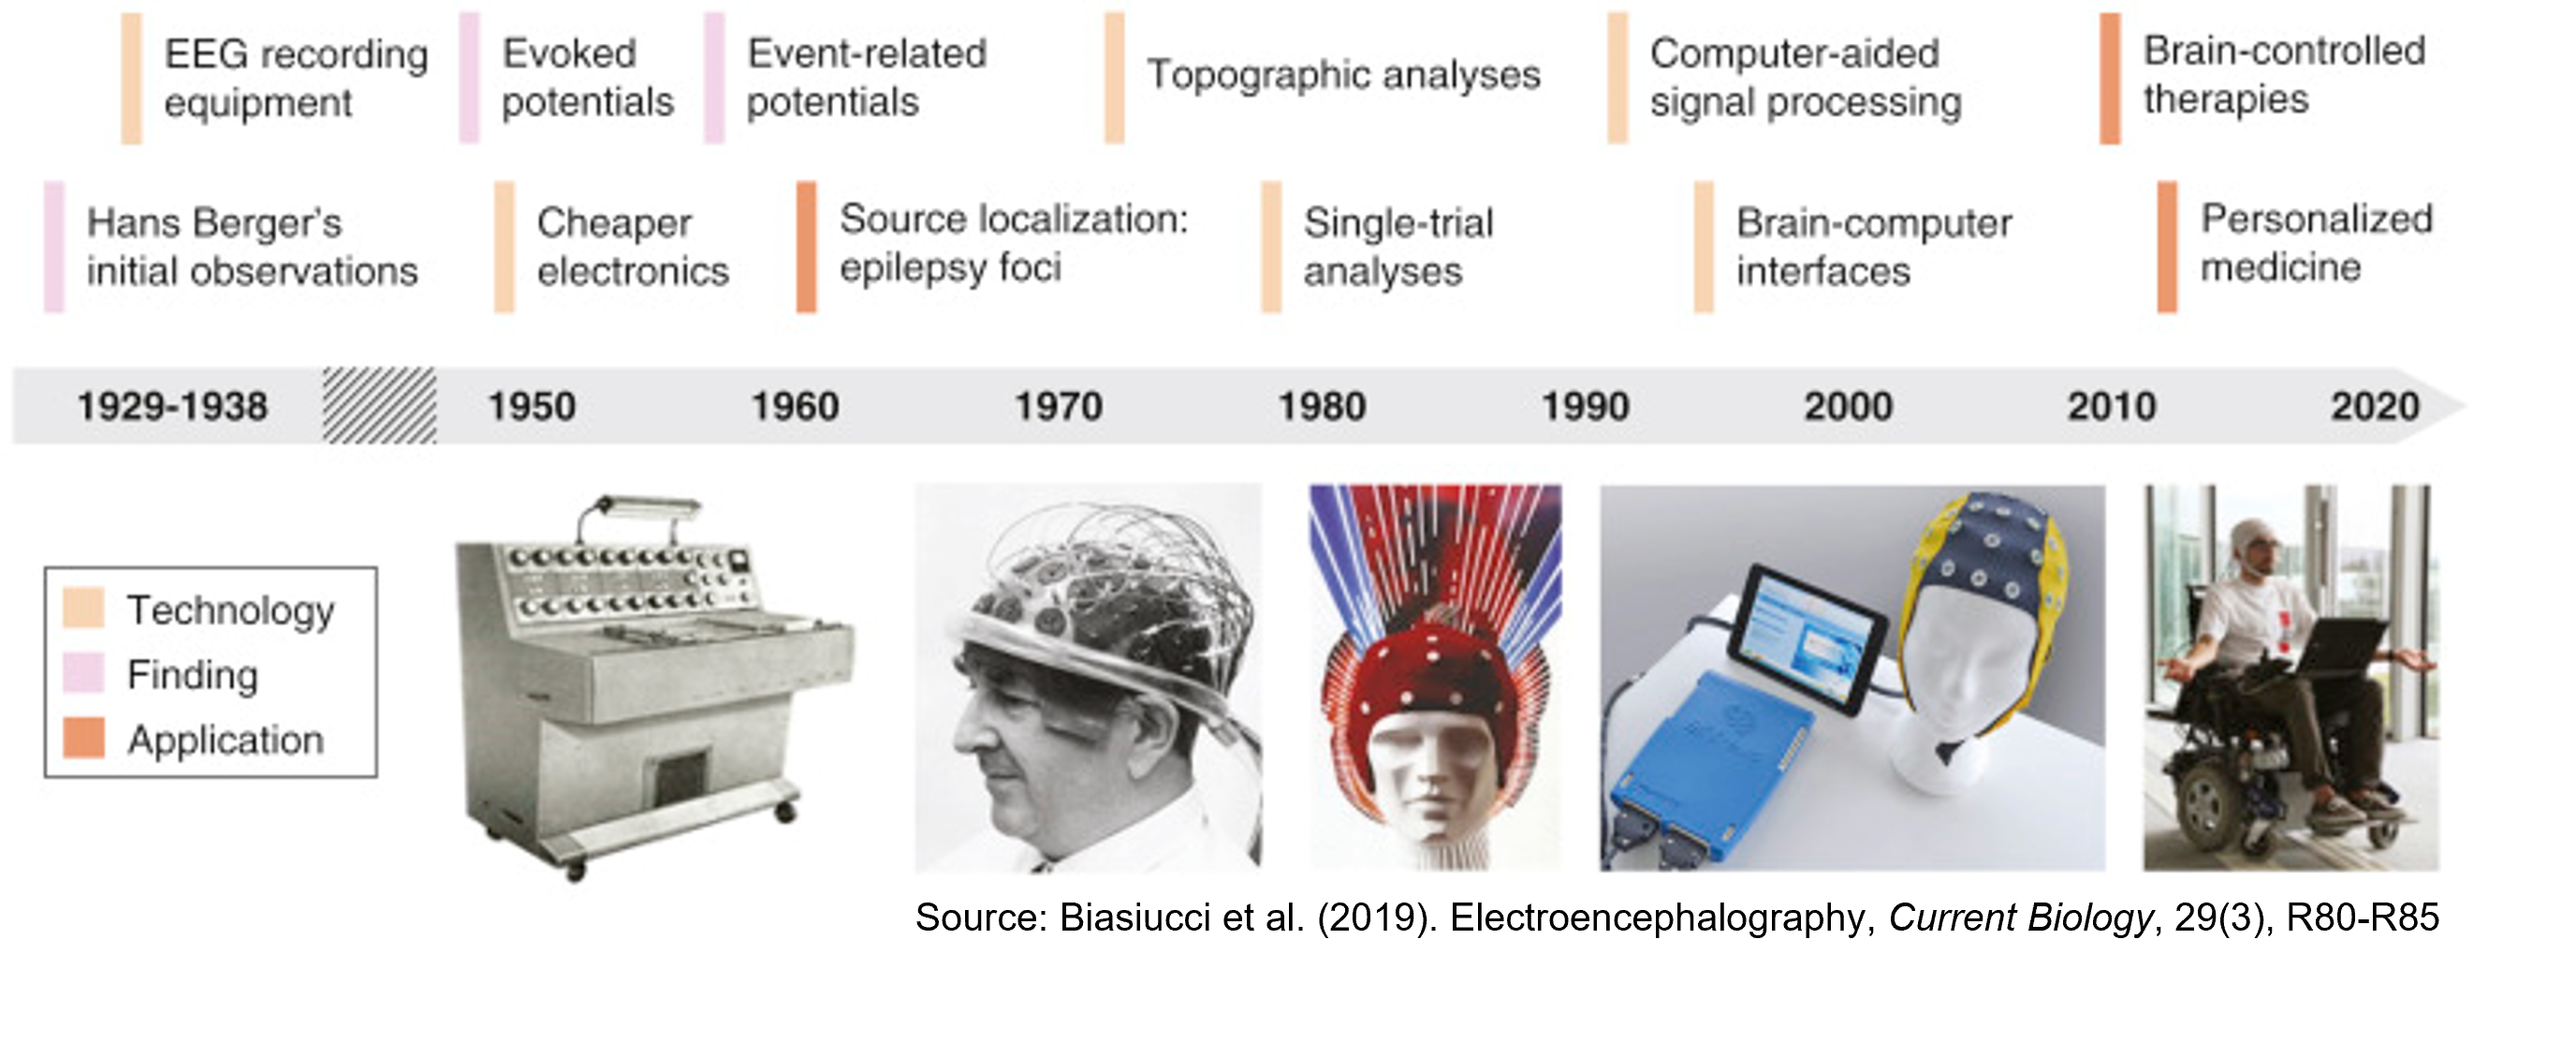
The history of EEG dates back to the late 19th century, when scientists first observed that electrical signals could be detected in the brains of animals. In 1875, the British physiologist Richard Caton published his first experiments in which he measured electrical potentials in the exposed brains of rabbits and monkeys.
In 1890, the German psychiatrist Hans Berger began to experiment with recording the electrical activity of the human brain. He used a simple string galvanometer to record the electrical activity from the scalp of his son and later from other subjects. In 1929, he published the first EEG recording from a human subject.
Throughout the 20th century, EEG technology continued to develop, becoming more refined and sophisticated. In the 1930s and 1940s, the first EEG machines were developed, which used vacuum tube amplifiers to improve the quality of the recordings. These early machines were large and expensive, and were mainly used for research purposes.
In the 1950s, the development of transistor technology made EEG machines more portable and affordable, and they began to be used more widely in clinical settings to diagnose and treat neurological disorders. In the 1960s and 1970s, computer technology was incorporated into EEG machines, allowing for the analysis and visualization of large amounts of data.
Today, EEG remains an important tool for diagnosing and studying a wide range of neurological conditions, including epilepsy, sleep disorders, and brain injuries. Recent advances in technology have also led to the development of new EEG-based applications, such as brain-computer interfaces and neurofeedback training.
Origins of EEG
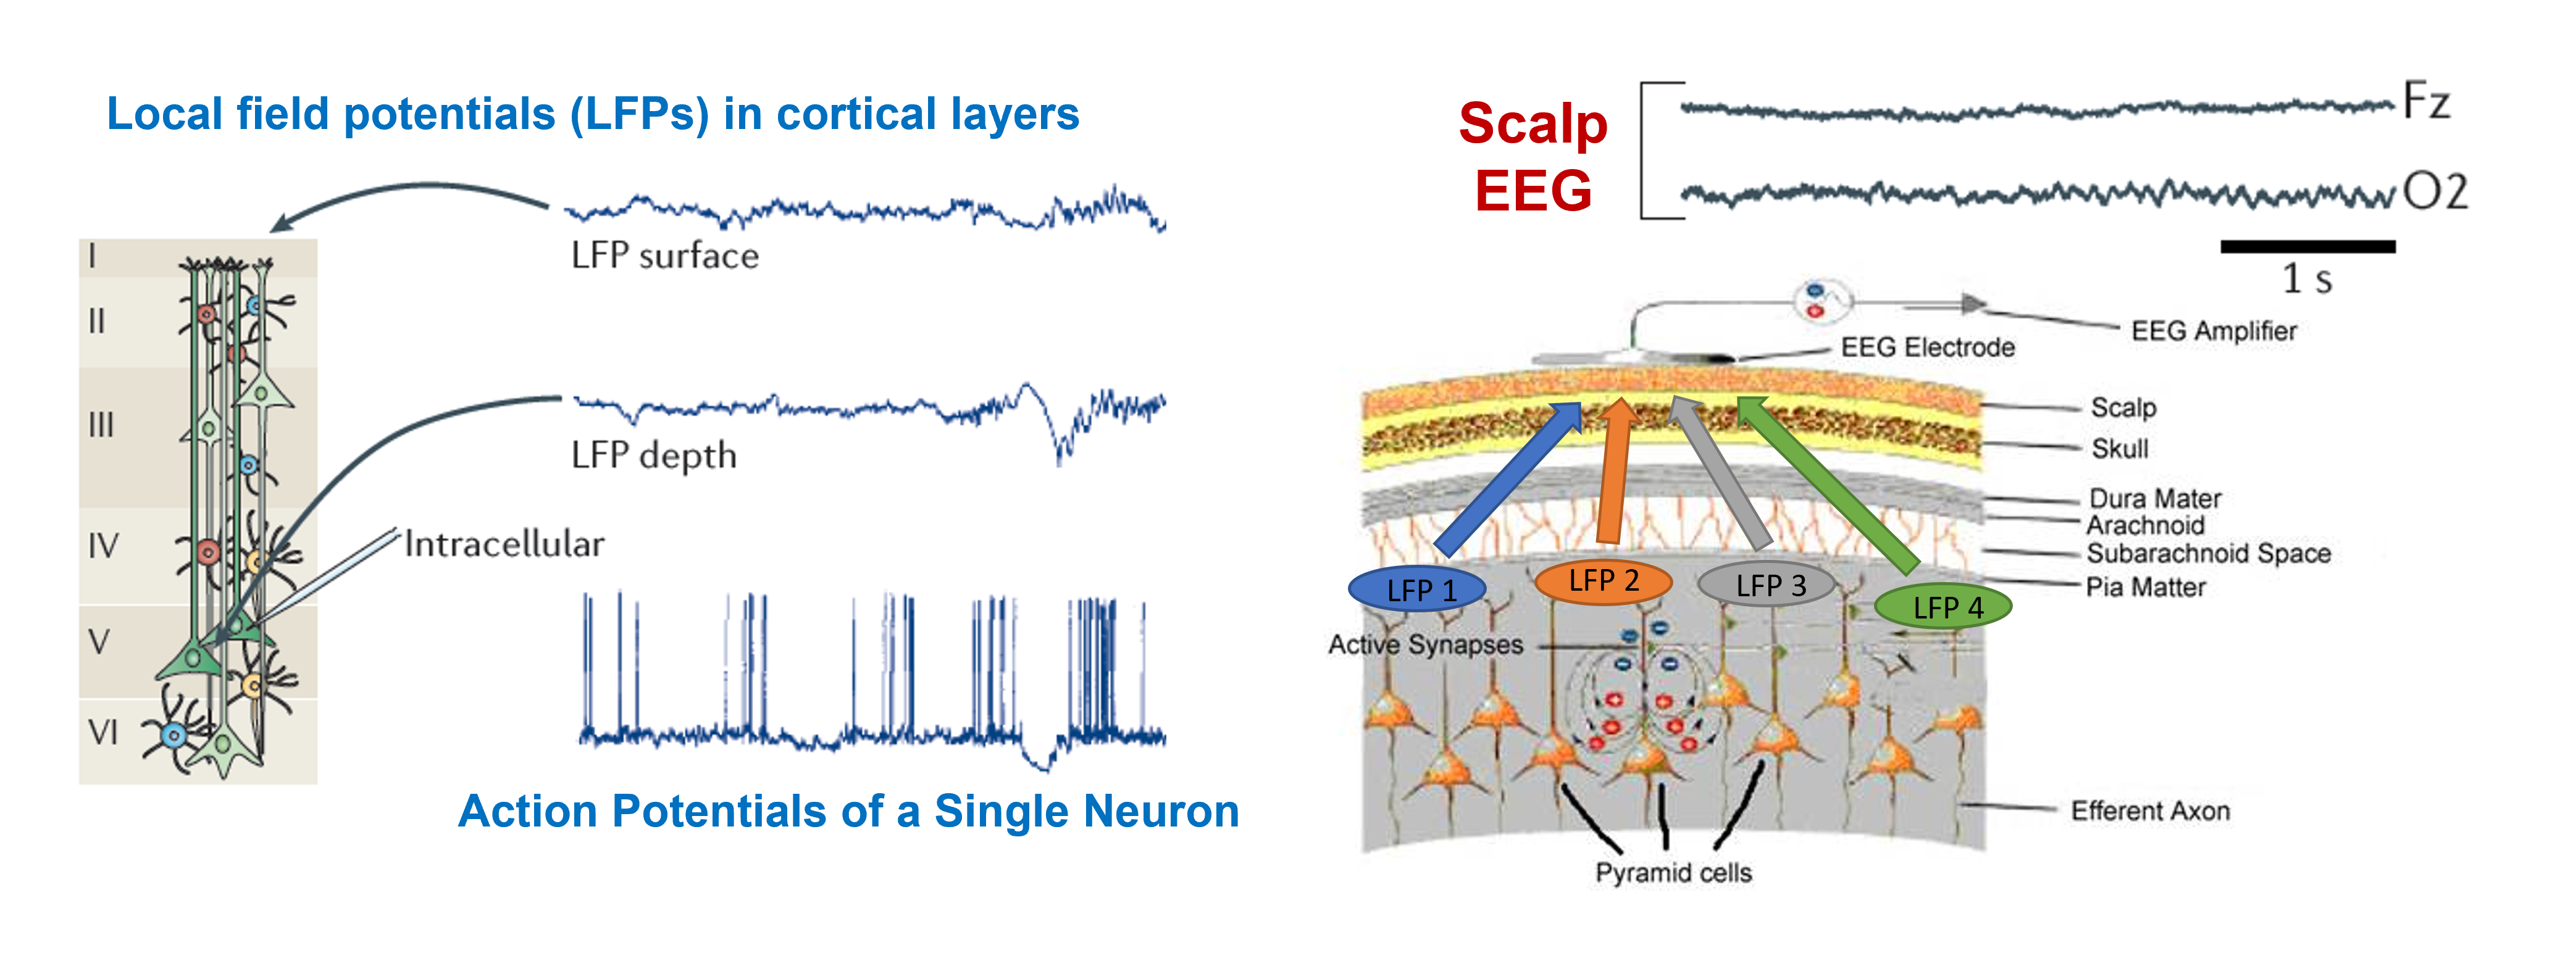
EEG measures the electrical activity of the brain cells (neurons). The brain is composed of billions of neurons that communicate with each other using electrical and chemical signals. These signals generate electrical currents that can be detected on the scalp using electrodes.
The electrical neuronal activities can be measured in mainly in 3 levels. First, the activity of single neurons (pyramidal cells) can be measured by the patch-clamp technique (single-unit recordings). Action potential is a rapid sequence of changes in the voltage across a membrane, which is characterized by short-duration (~1 ms) high-amplitude (~100 mV) pulses. Second, local field potential (LFP) is an aggregated electrical activity of a group neurons, which can be measured by electrode microarrays inserted in brain tissues. Third, synchronous electrical activities of multiple LFPs from numerous neuronal groups are further aggregated, and they can be detected as EEG by microscopic electrodes applied to scalp surface. LFP and EEG have similar spectral characteristics.
Spectra of EEG
EEG spectra refer to the frequency bands of electrical activity that are observed in EEG recordings. These spectra are divided into different frequency ranges, each of which is associated with different brain states and functions. The following are the most commonly recognized frequency bands in EEG:

Different brain regions can show different patterns of activity across these frequency bands, and analyzing these patterns can provide information about brain function and activity. EEG spectra are commonly used in clinical and research settings to diagnose and study neurological disorders, as well as in cognitive neuroscience to study brain activity during various mental states and tasks.
Montage of EEG
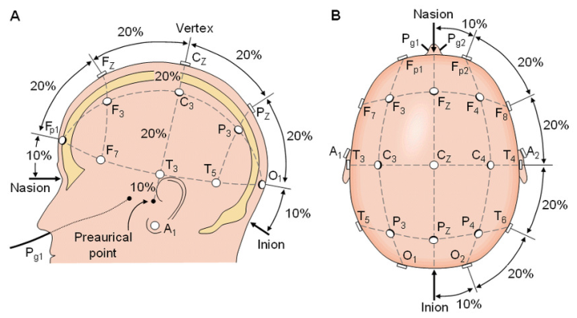
To standardize EEG electrode placement sites across studies, the international federation determined a standardized electrode placement system called the 10-20 system.
With the advanced EEG recording systems using large number of electrodes (>=64), the 10-20 system has expanded to the 10-10 and the 10-5 systems.

Domains of EEG Data Analysis
EEG signals usually collected from electrodes of multiple scalp areas at a high sampling rate (~1000 Hz). Therefore, single-domain or multi-domain analysis techniques can be used to examine brain activities and functions.
Time domain
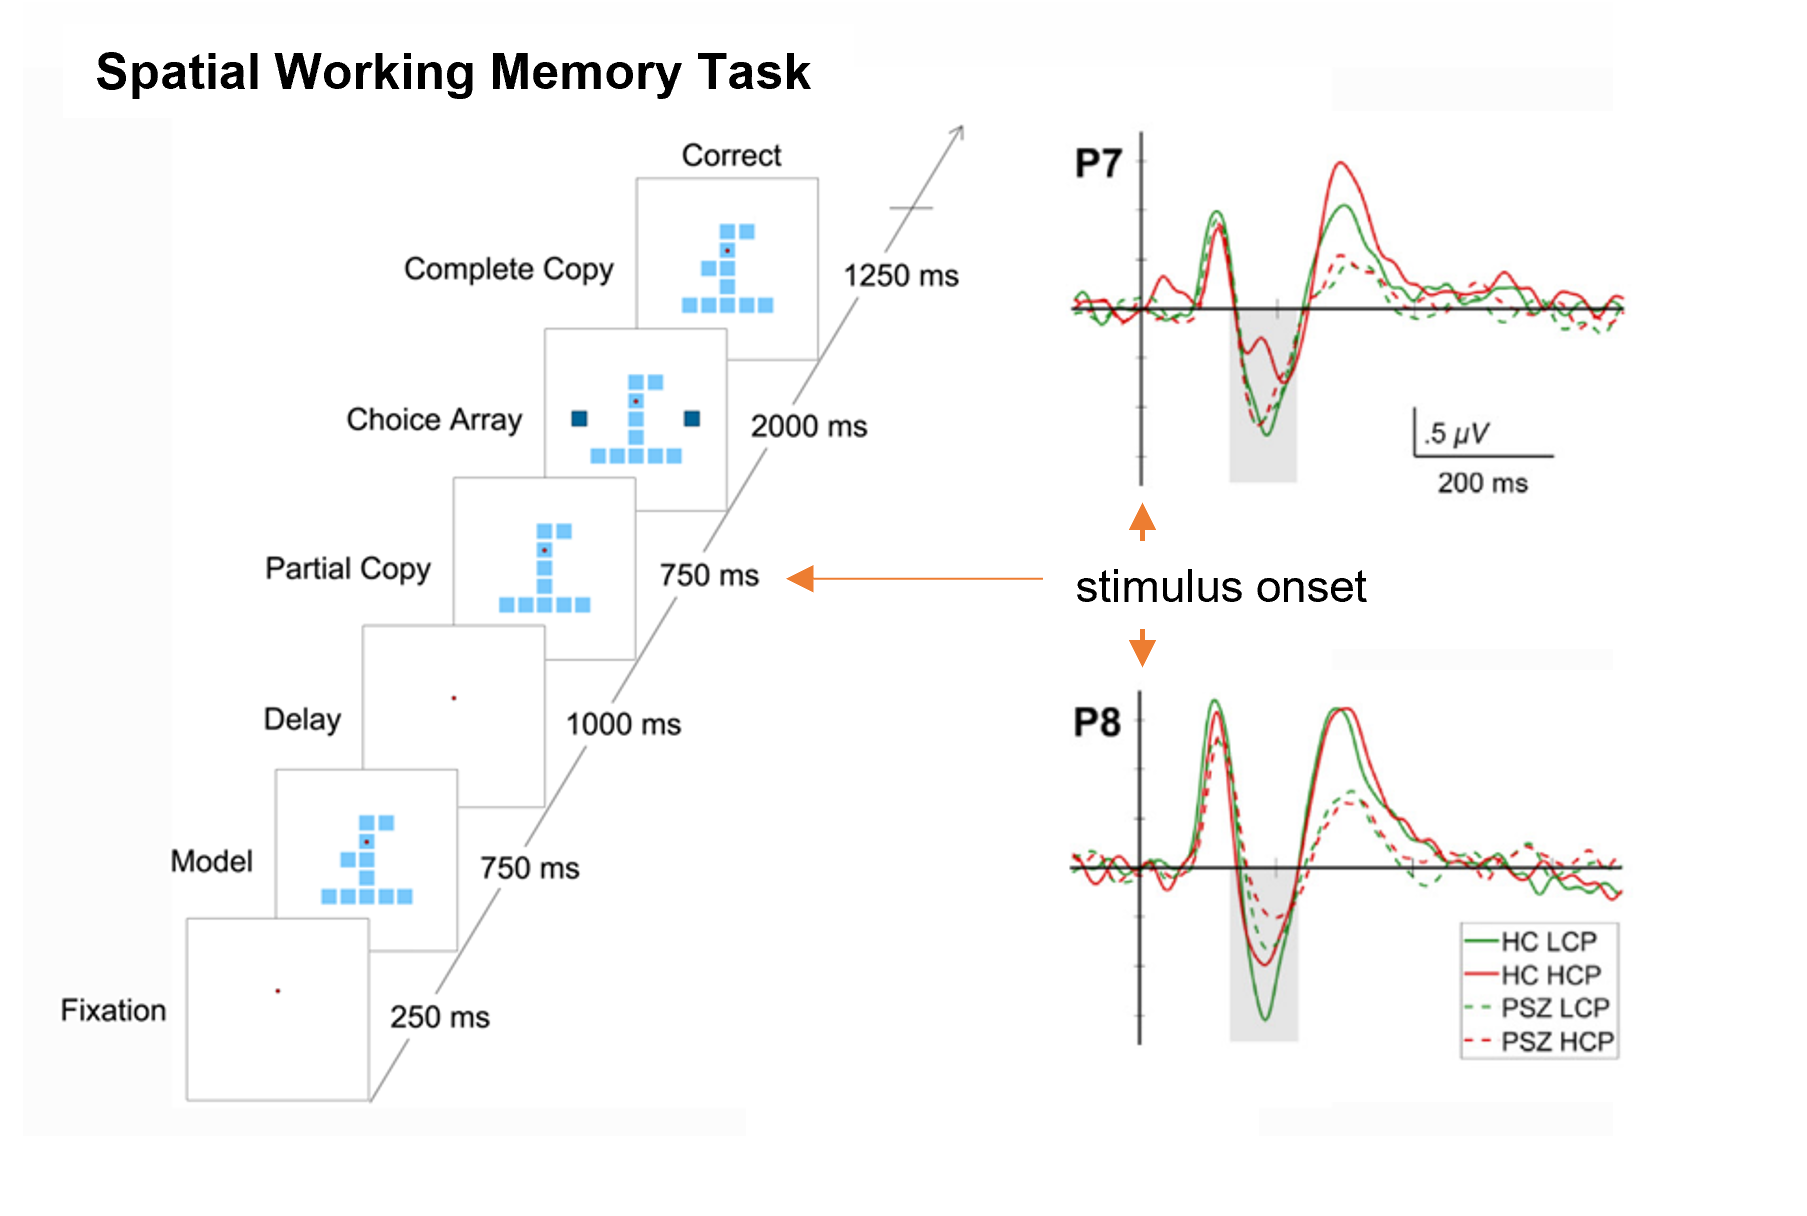
With high-temporal resolution, EEG has a unique strength as a tool to examine brain functions. In particular, when EEG is collected during which a subject perform a cognitive task, the EEG time-series can be analyzed for the task-related brain activities. Event-related potential (ERP) is the representative time-domain EEG analysis technique. By analyzing the amplitude and latency of an ERP component that is time-locked to a task event (e.g., stimulus onset), we can quantify the degree & timing of brain response related to the task performance.
Frequency domain
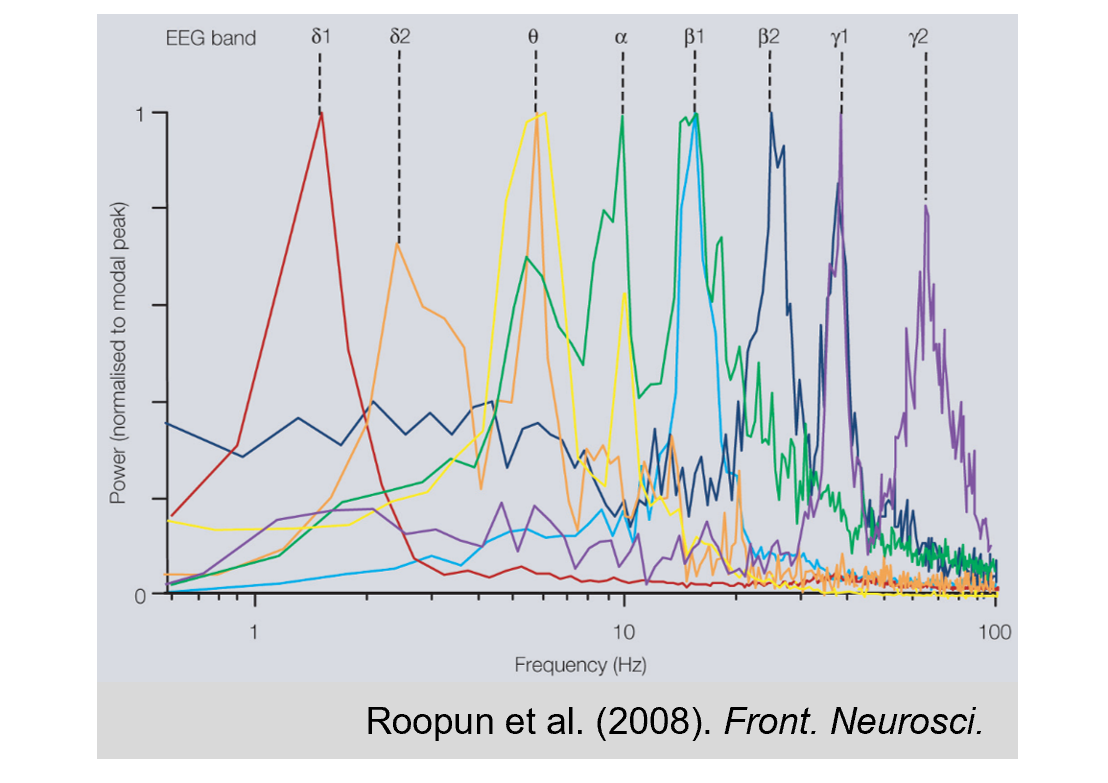
As highlighted & illustrated above, EEG signal can be analyzed in the frequency domain. Thanks to high temporal-resolution, a spectral decomposition technique (e.g., Fast Fourier Transform; FFT) can generate power spectrum density of an EEG time-series across wide frequency bands. Relative increase or decrease of spectral power in a specific frequency band provides unique information of the brain states and functions
Time-Frequency domain
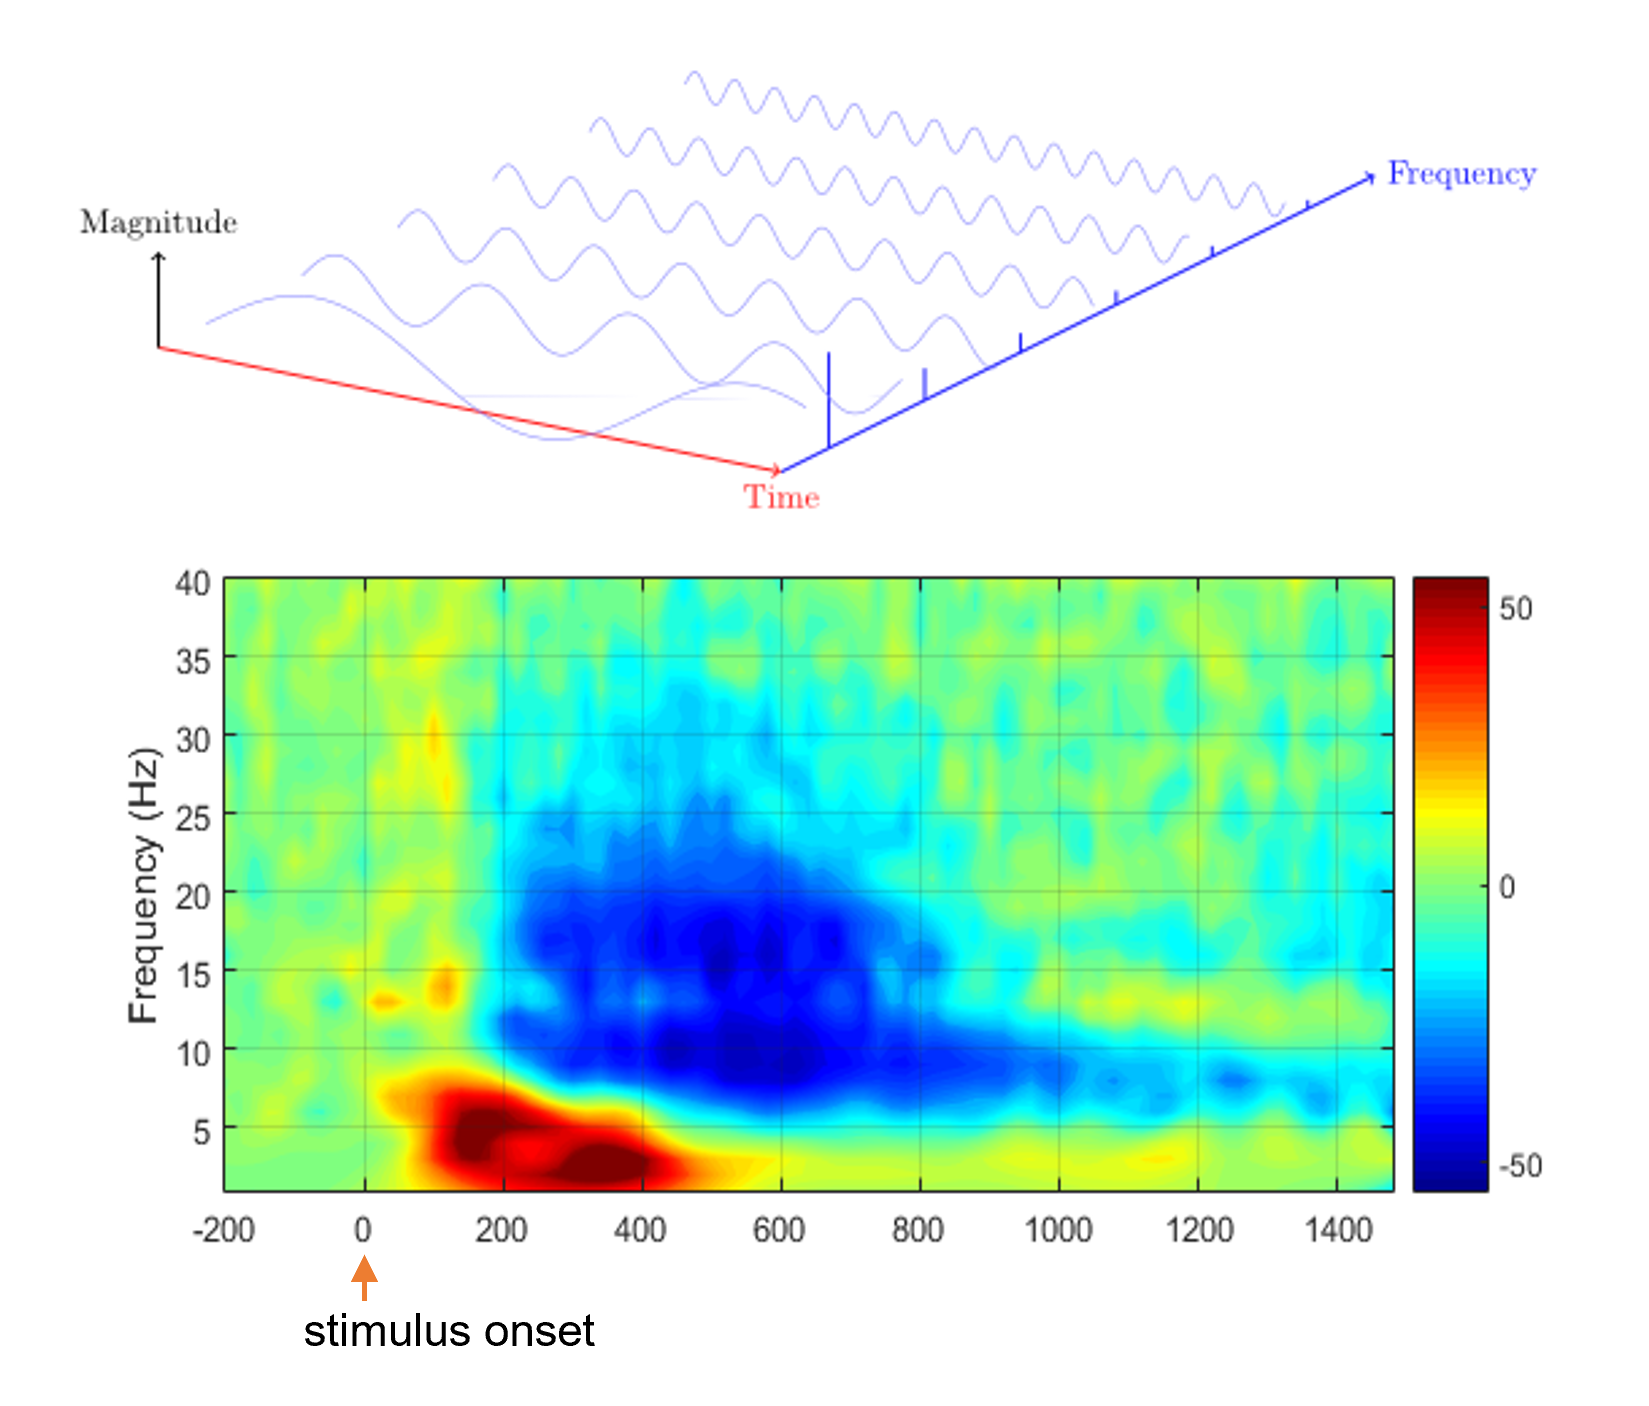
EEG signals represent electrical neural activities oscillating at multiple frequency bands. As briefly described above, different frequency EEG components reflect different brain states or neural processes. Like ERP techniques, Time-Frequency (TF) domain analysis allows to quantify the magnitude and latency of multiple frequency neural response components that are time-locked to a task event. As illustrated in the right TF-plot, in which the colors represent the power of oscillatory neural activities that vary across time and frequency axes, we can quantify the degree of neural oscillatory response component at a specific time & frequency (e.g., early theta response & late alpha response components).
Spatial domain
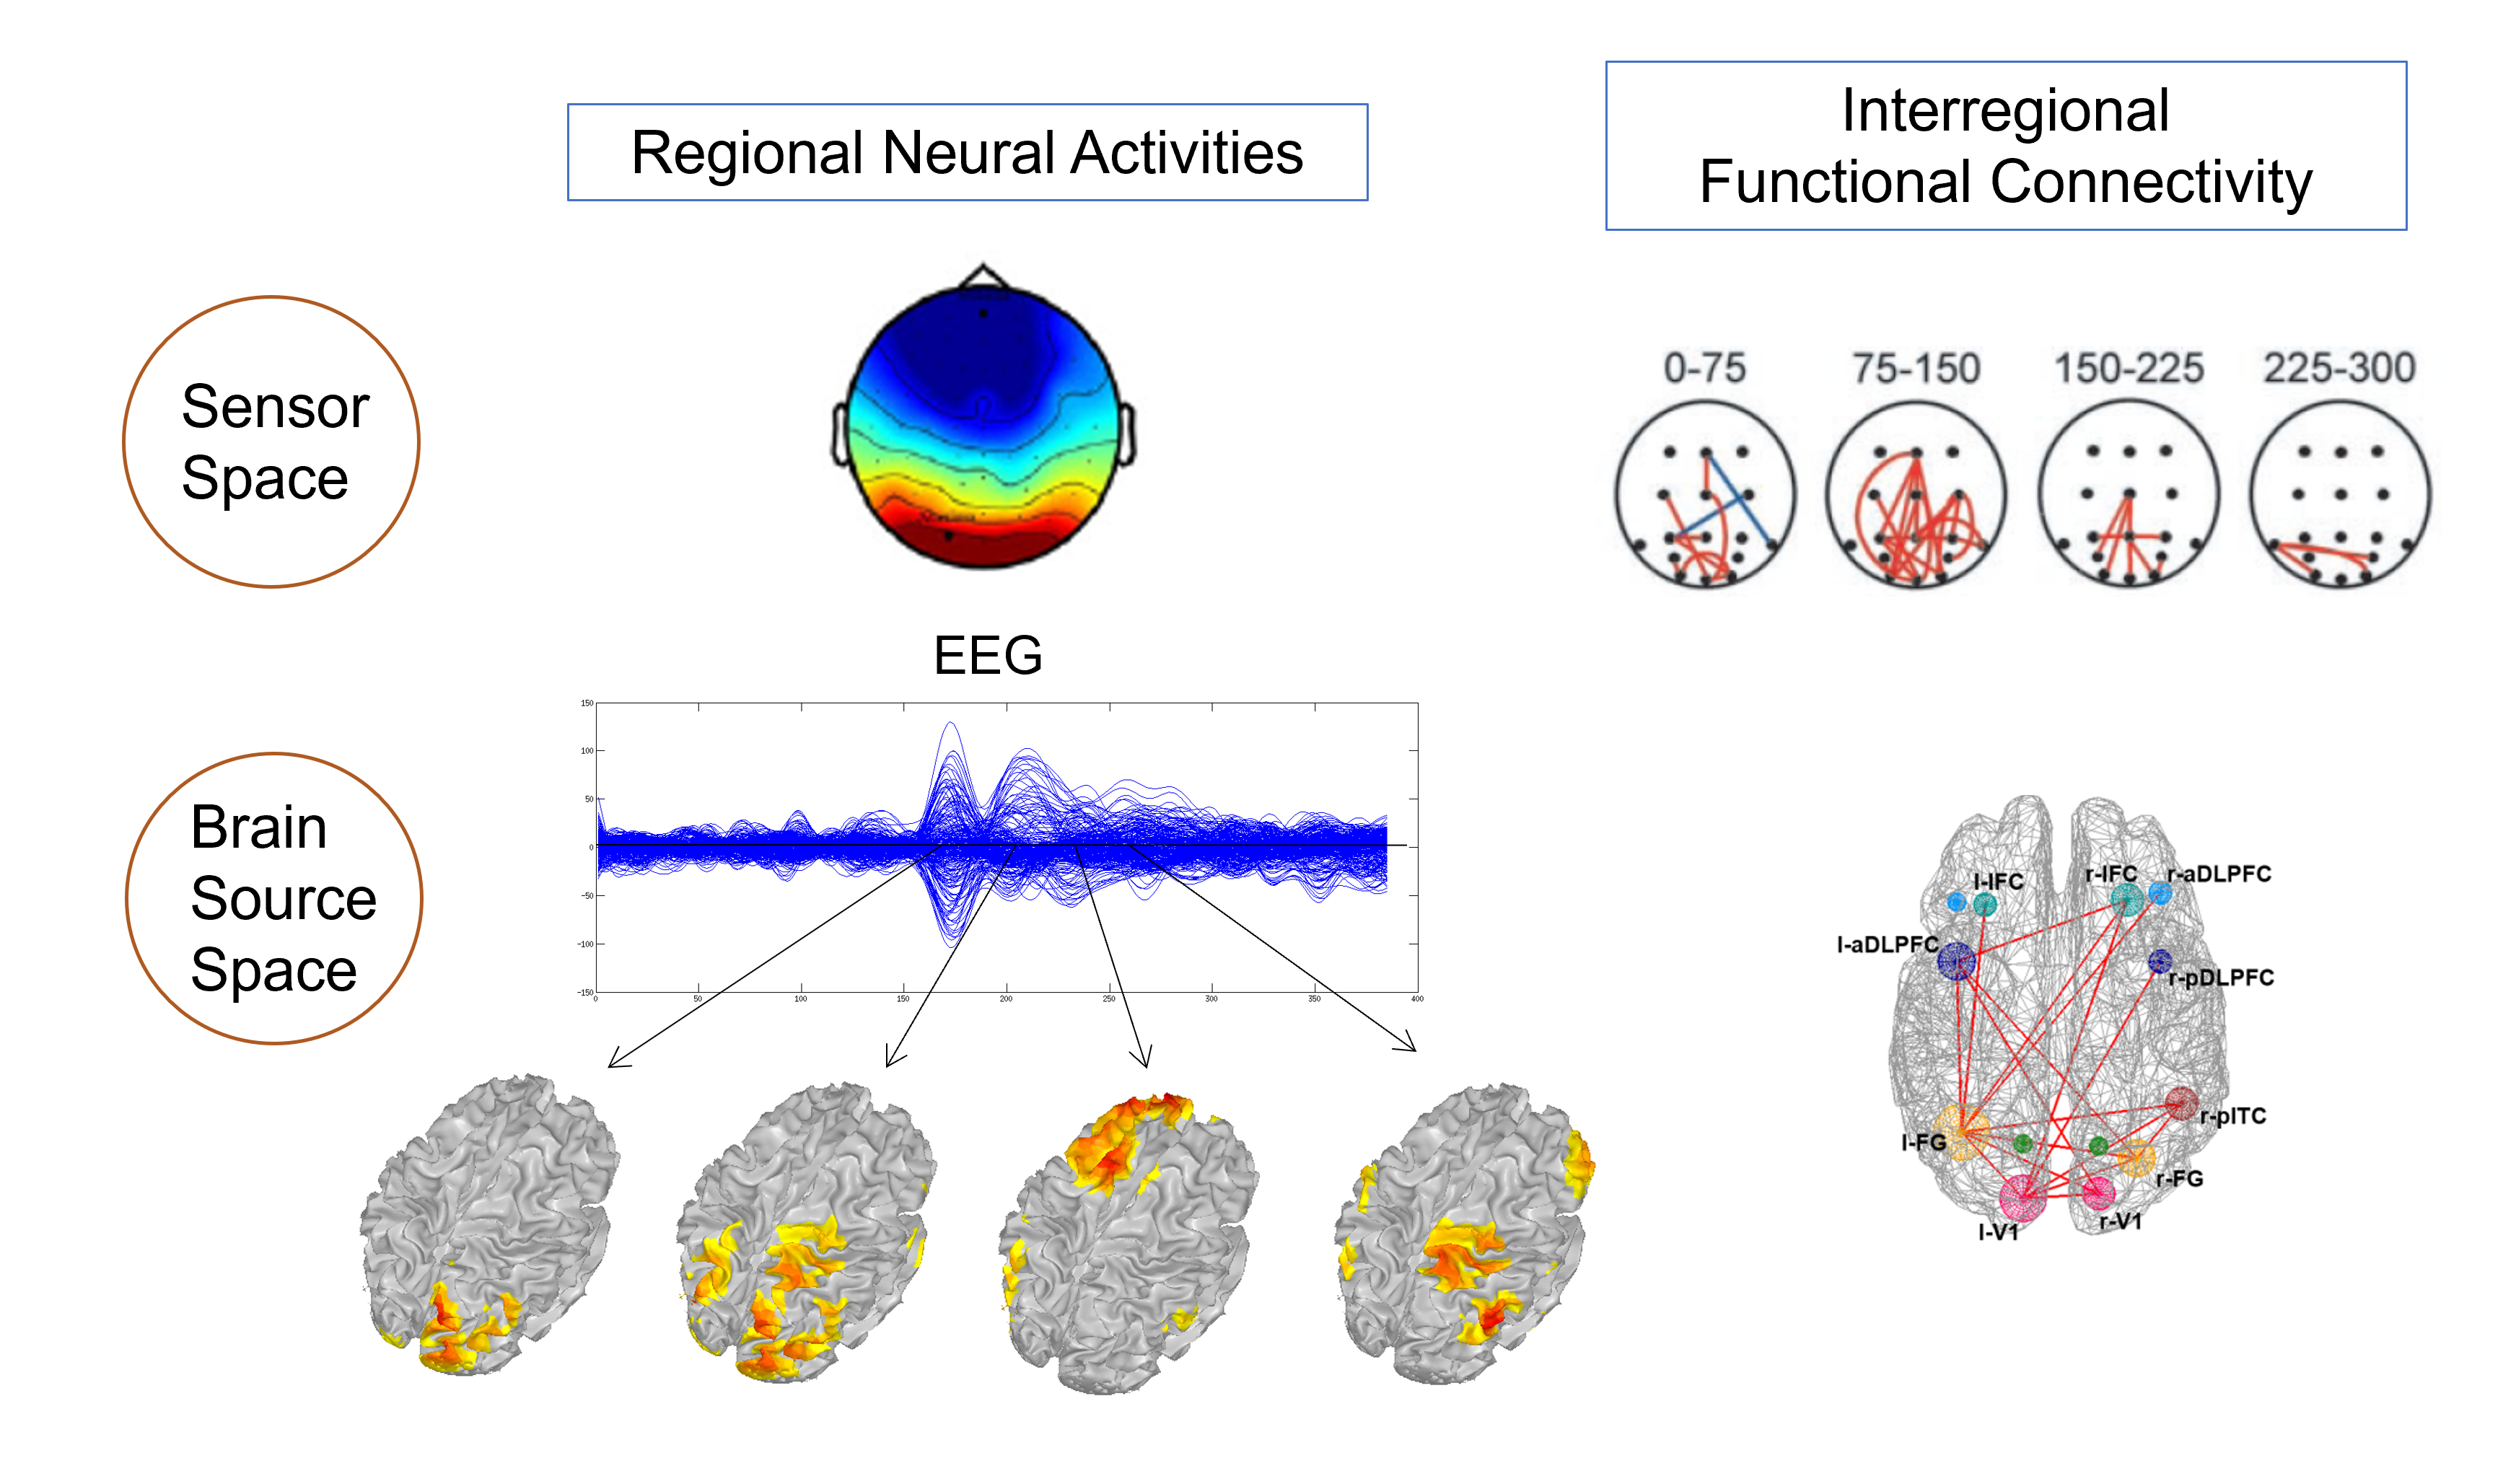
EEG signals are usually collected with multiple scalp electrodes. Therefore, the signal amplitude distribution across the electrode sites provides information about which brain regions are activated at a specific time point. Any EEG measures (i.e., time, frequency, or time-frequency components) of EEG signals can be represented in a scalp topography, which can be analyzed in terms of the relative magnitude of a brain response in frontal, central, parietal, occipital, and temporal sites.
Due to relatively low spatial resolution of EEG dataset and volume conduction effect, the spatial information of an EEG component in a sensor space cannot provide accurate location of the brain source. However, modern EEG recording systems use larger number of electrodes (64~256 channels) covering the most scalp regions. Utilizing such a high-density EEG (HD-EEG) system, an anatomical head model, and a computational algorithm, EEG scientists can estimate the brain source locations. The accuracy of source localization is dependent on the number of electrodes, EEG signal quality, the use of accurate and realistic anatomical model, and the use of an advanced electromagnetic computational algorithm. With sufficiently good use of the resources, EEG can be used as a functional neuroimaging tools like functional MRIs.
Lastly, inter-regional EEG signal similarity or synchronous patterns of oscillatory EEG activities can be used to estimate the degree of functional connectivity across brain regions. With an advanced brain source signal computation method, we can analyze the inter-regional functional connectivity in the brain source space in addition to the sensor space. These approaches allow EEG scientists to use EEG recordings for analyzing the brain network dyanmics.